Three Things We Learned from Cleaning One Million DMV Property Records
The DC, Maryland, and Virginia (DMV) region is facing a housing crisis. According to the Urban Institute’s report on the future of housing in the region, policymakers will need to preserve, produce, and protect housing to alleviate the crisis and accommodate expected regional growth. Zoning — how governments control what can be built on properties — is vital. Our research team wanted to know how much new housing we could hypothetically create around the DMV region without changing any of the existing zoning policies. Data science helped us turn disparate data into a usable regional housing dataset.
Combining datasets can unlock new insights
To date, governments have used a number of tools to create housing plans and estimate a region’s housing capacity. To those efforts, primary datasets included national survey data about net migration, poverty, rents, and other indicators of a strapped rental market, in addition to relying on local parcel and zoning data. Urban is undertaking efforts to centralize and improve zoning data. In the meantime, our team took an innovative approach — combining parcel and zoning data from across the DMV to estimate the region’s capacity to build more housing. This model — using data not easily combined — has the potential to be a powerful model for regional planners across the country.
To conduct our simulation, we combined disparate datasets about housing in the DMV area: one large parcel data file and zoning data files from several jurisdictions.
Jurisdictions collect parcel data for local tax assessment purposes, and thus, the data collected to support them differ across city and county lines. This creates data problems across jurisdictions, such as inconsistent address formatting, or missing data points, like lot size, for some parcels. We began with parcel data purchased from Black Knight, which eliminated some inconsistencies. Existing open data also proved helpful for quality control and to supplement our tax assessment data. From counties’ and cities’ open data portals, we pulled county parcel files and data on addresses, zoning shape files, and other open data sources that filled in where address, lot size, zoning, or other data points were missing or inconsistent.
Next, we needed zoning data. Zoning codes detail the restrictions on the types and sizes of buildings developers can construct on a parcel. In different states, different local governments (sometimes counties, cities, or smaller townships) have zoning authority. Montgomery County, Maryland, has a patchwork of zoning set by different authorities. The county has zoning codes, but 5 of the 18 cities and towns, including Rockville and Gaithersburg, 2 of the county’s biggest cities, have their own zoning codes. To code zoning information for properties in each jurisdiction, we read through the individual zoning regulations for three counties, several smaller incorporated cities, and DC. We converted the legal text — paragraphs about the allowed uses, height and density regulations, and lot sizes — into a spreadsheet that we would ultimately merge onto the parcel data.
Merging the data was not easy; both parcel and zoning data differ across jurisdictions, making standardization across the region difficult and time consuming. We needed to identify each individual residential parcel by longitude and latitude and merge it with information in the zoning regulations. The resulting dataset catalogs every building and piece of land in our analysis area and unlocks enormous potential to estimate regional growth.
We looked at all residential or vacant parcels in the region and found that with some redevelopment, we could build more than 50,000 additional units on vacant lots or underutilized lots without changing any zoning codes. With some strategic upzoning near transit and job centers, we could build even more units. That’s a lot of new housing! Other regions can combine parcel and zoning data with this method to set targeted development goals.
Test first on a subset
When working with new datasets, it’s easy to waste time cleaning fields you’ll never use. So with a big team under a tight deadline, a clear process becomes essential.
The best thing our team did was start on a smaller jurisdiction, test our method, and then apply it to other jurisdictions. Our team of programmers started with one pilot area: Arlington County, Virginia. Our first programmer cleaned the Arlington parcel data, matched it with the zoning code, and developed analyses that we could repeat for other jurisdictions.
Once we nailed down that method, the rest of our team used the code in other jurisdictions to clean the parcel data. But even with that tested process, the task was monumental. Each time we added a new county with its own land-use patterns, we had to tweak the code — in DC, for example, parks may be classified as vacant land and zoned for residentidal use, and assuming we wanted to maintain current green space, we had to merge on separate shapefiles for DC’s national and local parks to recode these parcels. Because of missing lot size data for condominiums in Montgomery County, we also used a spatial merge to match addresses to the correct lot from the county’s published parcel data file. We anticipated some of these complications by sharing results and code on Github, but we still iterated for each jurisdiction.
Twenty-four jurisdictions are members of the Metropolitan Washington Council of Governments (COG). Because cleaning just 6 of the 24 (the cities of Arlington, DC, Rockville, and Gaithersburg and Montgomery and Fairfax Counties) took several months of data collection and processing time, we had to limit our scope to just these areas.

This left an incomplete picture of the COG region and only covered roughly 1.2 million of its 2.0 million households. Considering the limited analysis area, the whole region has greater potential for growth than we could quantify in our analysis and has room to grow in areas that might most need housing affordable to those with low and middle incomes.
Without testing our cleaning methods first, we could have spent all our bandwidth cleaning data and not had time to do the analysis we cared about. By first focusing on the smaller area, we could re-create this method on a larger area or another region.
Visualize data to ground your analysis
With the data cleaning and merging complete, our data consisted of more than 1 million parcels matched to their property and zoning information. We used this merged dataset to map parcels in our analysis area. The analysis was conducted in R, and we used the ggplot data visualization package and the sf package for spatial analysis to create maps like this from our parcel data.
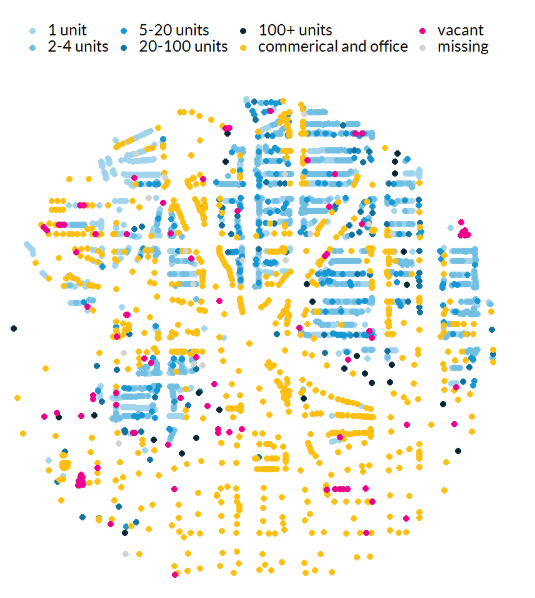
Visualizing housing data gives us a parcel-level view of neighborhoods, which we can use to identify key areas for housing growth. From the parcel data, we can see neighborhood density, vacant lots, or missing property-level data, and from the zoning data, we can see where residential construction and what density of housing is allowed. This was a good preview for our data cleaning.
We could now see where jurisdictions could create incentives for new development. We estimated that if multifamily developments were built on all the vacant lots zoned for multifamily construction, they could add 32,000 additional housing units in the jurisdictions in our analysis. When we extended the redevelopment to also include currently underutilized, multifamily residential buildings where redevelopment might be economically feasible (30 percent of the maximum density or lower), we found that we could add another 22,000 units. Those 54,000 total additional units — in just our six jurisdictions — amount to almost 15 percent of the 374,000-unit goal the region needs by 2030.
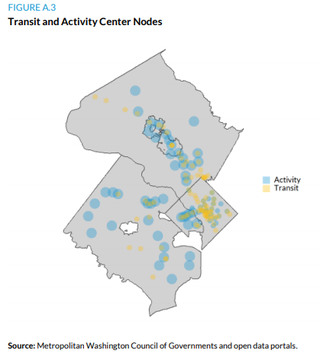
We also used this view to look at prime areas for upzoning around transit stops and activity centers like Dupont Circle. Upzoning the less dense areas in centers by 20 percent could create 47,000 units, some of which would overlap with the units that could be created from vacant land and underutilized properties.
It takes significant resources to move from precise neighborhood-level analysis to regional planning, but this method is a step toward accurate data and a better understanding of zoning policy’s regional impacts. It wouldn’t have been possible without some creative data work.
Ackowledgements: This analysis was funded by the Greater Washington Partnership and JPMorgan Chase as part of the the Regional Housing Framework. Thanks to everyone who worked on this project and their guidance with this post: Leah Hendey, Sarah Strochak, Chris Davis, Yi Peng Su, Rob Pitingolo, and Kassie Scott.