The Potential of Machine Learning for Compiling Standardized Zoning Data
Zoning codes, or the official documents that regulate a jurisdiction’s land use, contain an enormous amount of information about what buildings can be built in an area and how they can be used, with clear implications for racial equity, housing affordability, economic development, and environmental impact. Yet zoning documents are often long, complex, unstandardized, and sometimes handwritten, making the extraction of these data difficult. Without clear, standardized zoning data, researchers and policymakers lack empirical evidence to answer questions about how zoning affects housing supply and to pursue specific reforms.
Many states have begun to build towards a National Zoning Atlas, which would collect data for each zoning district, the smallest regulatory building blocks within a jurisdiction, in one place. But constructing and updating this atlas requires a significant manual effort. To ease this process, we partnered with Sara Bronin and the National Zoning Atlas to explore how text analysis and natural language processing methods could help automate collecting standardized zoning data, publishing a report with findings and reflections from our pilot project.
Testing automated methods
To gauge how much of the data collection process could be automated, we conducted an illustrative case study with Connecticut data, intending to expand to the rest of the country if we were successful. Importantly for this case study, we had access to “ground truth” data from the Connecticut Zoning Atlas, which we could compare against our results. If the results were sufficiently encouraging, we could extend to other states where we don’t already have benchmark data. Our methodology consisted of four major steps, each of which presented unique challenges, which are illustrated in the diagram below:

1. Gather and process zoning code text data
The first step for any data collection process, automated or manual, is to gather all the documents in our “universe” — in this case, all jurisdictions in Connecticut. Luckily for us, the National Zoning Atlas team in Connecticut, led by Sara Bronin, has diligently collected zoning codes and maps from a variety of sources, including municipal websites, GIS repositories, local law databases, and even manual outreach to jurisdiction staff. Although unnecessary for our case study, web scraping techniques could lighten the burden of this step for other states.
After saving documents in PDF, PNG, or JPEG format, we extracted the text using Amazon Web Services’s Textract Optical Character Recognition (OCR) software. Textract returns a series of JSON objects for each document that contain the output from text extraction, which we wrangled and appended into pandas dataframes in Python for further analysis.
2. Identify zoning district names using algorithmic matching
With our dataset compiled, we needed to identify the names for each observation, a deceptively challenging task for multiple reasons: First, zoning districts can have both full and abbreviated names (e.g., “Residential 1” versus “R-1”). Second, listed districts can vary between the zoning code and zoning map. And third, district names often don’t appear neatly in one place in a document.
To address these problems, we implemented a fuzzy matching comparison between text that appears in the legend and labels of a zoning map with text that appears in the zoning code. For the town of Andover, for example, the one-page map lists all of the zoning districts in the legend, while a particular page of the zoning code lists the districts just after the phrase “divided into the.” We used that term and many other common terms to reduce the long zoning documents down to more manageable subsets.

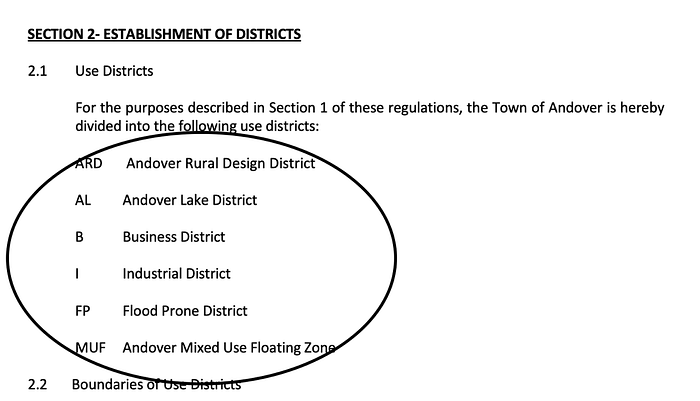
We then scored vocabularies — in this case, unique sets of phrases — across the two document types. A score of 100 would mean two strings are exactly the same, while a score of 0 would mean they have no characters in common. Using SeatGeek’s thefuzz Python package, we chose thresholds for what constitutes a “match” through iterative testing on a small training set of jurisdictions. We go to all the trouble of fuzzy matching to ensure that near matches across documents are captured. A great example is “ARRD — Andover Rural Residential Design District” in the map and “ARD Andover Rural Design District” in the code, which are clearly referring to the same district but would be missed by exact string matching.
We kept pairs that had sufficiently high fuzzy matching scores and filtered out terms that didn’t meet the threshold or appear in our list of stop words — the insignificant text we don’t want — such as “and,” “the,” and “or.” We erred on the side of casting a wide net to capture as many true district names as possible. Unfortunately, this cautious approach meant there were numerous examples of false positives, or algorithmically identified zoning districts that aren’t actual zoning districts.
We were able to identify 55.2 percent of all mapped zoning districts in the Connecticut Zoning Atlas data, once we had sorted out the many false positives. Given the unstandardized nature of our text data, our methods showed some promise but weren’t a perfect replacement for researcher review.
3. Create text datasets for each zoning district to inform modeling
After manually filling in the gaps in our dataset, we sought to build a corpus, or dataset containing the relevant text for all of the identified zoning districts. Ideally, each corpus would contain whatever relevant information a natural language model needed to make predictions. For this case study, we tackled just one of the dozens of columns in the National Zoning Atlas data: the type of zoning district, which can be either primarily residential, mixed with residential, or nonresidential. Asking, What type of zoning district is this? is a three-class classification problem and a much more concrete task than an open-ended question such as, What is the minimum lot size for a district?
To create the corpus, we searched for instances where an identified zoning district occurred with a certain window of other relevant vocabulary words. For example, the affordable housing category contained terms like “affordable,” “opportunity,” and “workforce” that subject-matter experts have associated with affordable housing districts. (The exact search criteria were slightly more complex than this and involved the use of regular expressions to match special patterns of character combinations in the text.)
Unfortunately, we encountered some major limitations at this step. First, we learned that much of the information we were looking for exists in tabular form for many zoning codes. Although the OCR software can extract text from tables and even maintain their original structure, we were unable to automate the process of interpreting the wide variety of table formats across the documents (e.g., seeing where a given row and column intersect). Information presented in this fashion was incompatible with our window-based approach, and future efforts will have to find another way to parse tabular data.
Given the density and varying structure of zoning documents, this window approach often returned text that wouldn’t be useful to a natural language model. Many of our datasets didn’t pass the “eye test,” meaning a human reader would be unlikely to find much useful text, let alone a machine reader. Still, we evaluated whether a combination of information from the zoning district names and these limited-quality datasets was enough to classify zoning districts by type.
4. Generate zoning district information by training a natural language model
We used two types of variables for the machine learning portion of this case study. First, we created a set of term frequency-inverse document frequency (TF-IDF) features using the set of all words in the zoning district names collected by the National Zoning Atlas. TF-IDF calculates how often words appear in zoning district names, but it places more weight on words that are more distinctive and less weight on words that are more common throughout the data.
We also used information from the text datasets created in the previous step to create term concentration variables for each of the three classes. To do this, we counted the number of times search terms related to primarily residential, mixed with residential, and nonresidential district types occurred in each dataset, scaling those counts by the average length of text datasets for that town’s zoning districts.
We split the districts into a 70 percent training set and a 30 percent test set, experimenting with three types of classifiers: a baseline logistic regression, a random forest, and a support vector classifier. We performed five-fold cross validation, which entails dividing the training set into five groups of equal size, with the different groups taking turns being used to both train the model and validate the model. This step allowed us to compare different classifiers and ultimately select our best performing model, a support vector classifier with a linear kernel.
The table below shows model performance on the 716 districts in the test dataset. All major metrics are hovering right around 75 percent, significantly better than the baseline “model-less” approach we used, which followed a set of naive classification rules and achieved only about 64 percent accuracy.
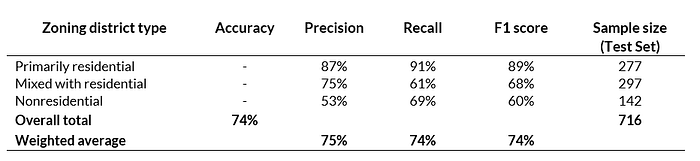
Clearly, our support vector classifier is learning something from the text information that helps to improve predictive power, but the variable importance plot below presents two reasons for caution. First, the occurrence of the words “residential” and “residence” in the zoning district names are the most important for predictiveness, which could explain why the precision and recall are particularly high among primarily residential districts and indicates that the model is relying on something any human reader could quickly recognize as well (e.g., a district called “Residential 1” is trivial to classify as primarily residential). Second, our term concentration features, which are missing from the chart below, were among the least predictive variables, suggesting essentially no information derived from our text datasets proved useful to the model.

Where do we go from here?
We learned early in our automation journey that completely removing human researchers from this process was impractical and ineffective. Even with marginal improvements in zoning district identification or the machine learning analysis, the unstandardized nature of zoning documents presents too many barriers for this to be feasible. Still, we discovered many areas of promise that are worth pursuing in a hybrid approach, combining the relative strengths of National Zoning Atlas teams and our algorithmic approach.
We believe that automation can make data collection efforts easier in many areas, including web scraping to collect zoning documents, OCR to quickly and effectively extract text from documents, text analysis to flag relevant portions and save time for human reviewers, and data validation rules to speed up the current manual checks.
Future efforts to improve a fully or partially automated methodology should start with tabular machine learning methods for parsing data in tables that were beyond the scope of this case study. Perhaps more importantly, advocating for the standardization of zoning documents is crucial. For now, we conclude that a hybrid human-machine approach is the best way to expand the availability of zoning data for policy analysis.