Local-Level Data and Tools Can Inform Efforts to Strengthen Community Food Systems against Climate Hazards
When local food systems are equitable and resilient, they can weather and recover from disruptions while ensuring all residents can produce and consume the food they need. However, very little local-level data exist on the relationships between climate hazards, agricultural production, food access, food security, and racial equity. To explore these connections and engage communities with rigorous data science and policy expertise, the Urban Institute has developed a pilot data tool through its recently launched Racial Equity Analytics Lab, which brings data to bear on complex challenges in advancing racial equity.
Local food systems encompass the production and distribution of foods (PDF) as well as households’ ready access to affordable nutrition — with these three sides of the system often disconnected but all susceptible to climate hazards. These interconnected vulnerabilities to food systems from climate hazards, including higher rates of food insecurity and lower access to food resources like retail stores and charitable food, cause disproportionate harms to communities of color because of historical and persistent policies and practices that systematically have removed opportunities and assets from Black, Latinx, and Native communities, who also face disproportionate harms because of climate hazards.
Consequently, climate hazards risk disrupting local food systems in ways that deepen and accelerate racial inequities. Local-level data can help identify communities most at risk of these challenges and characterize their unique characteristics.
Building a data tool to assess local food system resilience
Our pilot data tool can help identify communities of color whose local food systems have been vulnerable to climate events and who may have insufficient resources to mitigate these risks. These data can help inform priorities for place-based investments to build resilience and reduce inequities. For example, such data could inform investments in renewable agriculture and grants for producers of color in areas where climate hazards could undermine local production.
We draw on multiple data sources to identify and display counties facing intersecting challenges, including food insecurity (both overall and for Black and Latinx communities) from Feeding America’s Map the Meal Gap study, production of edible foods (including crops and animal products) from the US Department of Agriculture’s Census of Agriculture, and historical climate hazard damages caused by drought, flooding, and wildfires from the Spatial Hazard Events and Losses Database at Arizona State University, the last of which we average together into an index. Our team utilized R for the entire analysis, including packages from the tidyverse for data wrangling and visualization; tidycensus and tigris for pulling information from the American Community Survey and for county geographies; dbscan for the k-nearest neighbors analysis; and shiny, shinyjs, and Leaflet for building the maps and other visualizations that power our RShiny application.
We constructed national-level maps depicting whether counties are in the top quintile of both climate damages and food systems risks, which we define as county-level food security rates, high levels of human-consumable agricultural production, or tribal land presence. In the absence of sufficient local-level food insecurity data among Native communities, we identified counties with tribal lands as a proxy to ensure Native communities, who have disproportionately high rates of food insecurity, can receive the supports they need to remain resilient to climate events.
To illustrate the intersecting challenges of food system resilience, we overlay counties in the top 20 percent for food insecurity rates among their Black and Latinx residents (blue) and per capita damages from climate hazards (yellow) together (magenta).
Nearly 50 US Counties Face Intersecting Climate and Food Security Risks for Black and Latinx Residents
Counties in the top quintile of historical climate damages per capita from floods, wildfires, and droughts from 2012–2021 and food insecurity rates for Black and Latinx residents
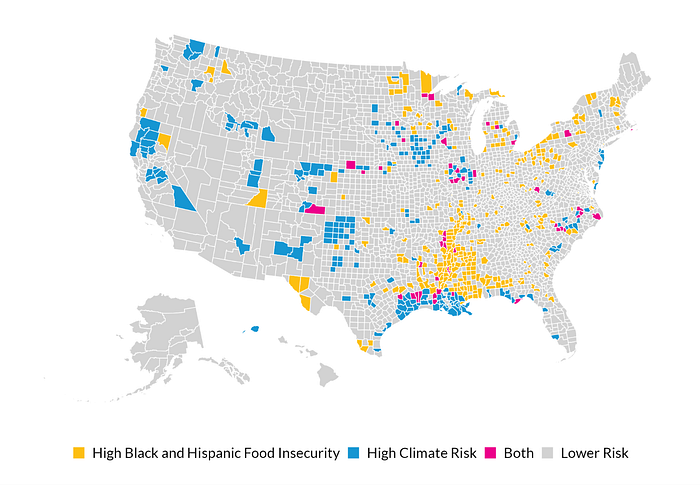
Though we see pockets of elevated Black and Latinx food insecurity across the Sun Belt and parts of Appalachia, as well as clusters of higher climate hazard damages in California, the Gulf Coast, and the Midwest, there are 47 counties that experience both types of challenges at high rates. Among these counties, floods, droughts, and wildfires have caused an average of $5,466 per capita in damages over the past 10 years, and one-quarter of Black and Latinx households (26 percent) are food insecure. For all other counties, the average hazards damage was barely half as high ($2,745 per capita) and the Black and Latinx food insecurity rate is on average 18 percent.
These communities facing intersecting climate damages and food insecurity risks may experience outsize challenges in recovering from climate events, as residents may already struggle with meeting their day-to-day food needs. Elevated rates of food insecurity suggest residents may experience increased risks of chronic disease and mental health conditions and may ultimately face severe financial distress and material hardship when trying to meet their daily needs. High levels of damage from climate hazards may make it challenging for residents to recover from climate events, meaning residents may have to trade-off between rebuilding post-disaster and meeting their immediate basic needs.
By zooming in to particular geographies, the map allows us to observe patterns, particularly for potentially overlooked areas. We can see three smaller parishes in Louisiana — Evangeline, Avoyelles, and Acadia — that fall among the 47 identified counties. Although these parishes are near other communities that face separate climate and food security challenges (see nearby yellow and blue counties in the map above), they uniquely face both. By identifying areas like these with intersecting climate and food security challenges, government and philanthropic partners can better target resources and supports.
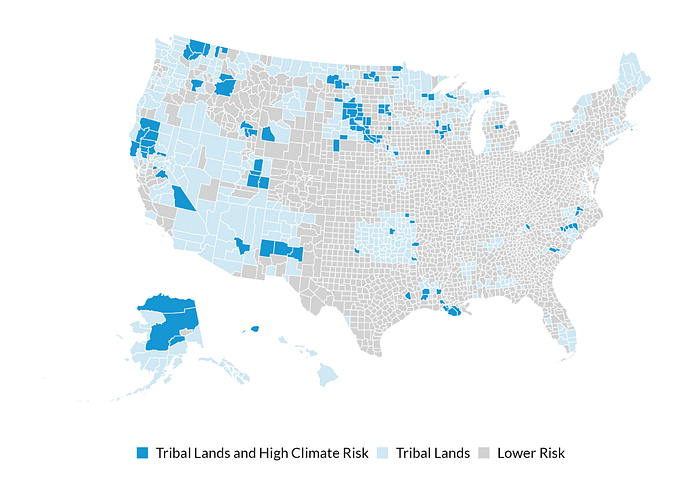
We also produced a map view overlaying the 544 counties that contain tribal lands (in light blue) with counties that are in the top quintile for climate hazards, finding 92 counties with both (in blue). Areas in the tribal lands of the Cheyenne, Standing Rock Sioux Tribe, Paskenta Tribe, Acoma Pueblo, and United Houma in states such as Wyoming, the Dakotas, California, New Mexico, and Louisiana are among those who face high climate hazards (in terms of dollar damages between 2012 and 2021).
Across all 92 high-damage tribal counties, the average amount of climate damage per capita over the past 10 years is $4,029, more than three times higher than ($1,194) other nontribal counties that experienced climate damages. These areas could benefit from additional policy supports to respond to and weather climate hazards.
Nearly 100 US Counties with Tribal Lands Face High Climate-Related Damages
Counties with tribal land presence in the top quintile of climate damages per capita from floods, wildfires, and droughts from 2012–2021
In previous Urban work, community collaboratives have been a valuable resource to help local areas make evidence-based decisions that advance equity, so we also wanted to help counties identify other areas that share similar vulnerabilities. To do so, we used the k-nearest neighbors function in the dbscan package to run a five-nearest neighbors analysis. For each of our three domain areas — food insecurity, climate hazards, and agricultural production of human-consumable foods — we selected each county’s five closest counties as measured by the Euclidean distance between variable values. This function complements the maps and enables counties to explore other communities that share similar risk profiles, which could support partnership development, coordination, and idea sharing to tackle food system resilience challenges.
For any county, its “nearest neighbors” can differ widely by size, geography, and demographic makeup. For Evangeline Parish, its nearest neighbors in terms of experiencing climate hazards span four states (Louisiana, New Jersey, Florida, and Texas) and include larger counties (Atlantic County, New Jersey, and Nueces County, Texas), predominantly Black or Hispanic counties (St. Landry Parish, Louisiana, and Nueces County), and smaller or predominantly white counties (Holmes County, Florida, and Vernon Parish, Louisiana).
By identifying communities with shared challenges, localities can understand how different factors affect food systems’ resilience, share resources, and explore mutually beneficial strategies. Finding counties that aren’t necessarily geographical neighbors but that experience similar challenges can elevate the common concerns between areas that could seem different at first glance, leading to further coalition building (PDF). In other words, data can assist in developing shared efforts to proactively address food system risks in an era of rapid climate change.
Connections between local climate hazards, food systems, and racial equity
Throughout this analysis, our team learned the importance of both grounding analytical work in theory and ensuring research met distinct community needs. During the course of this project, we engaged community-based organizations and leaders on identifying key variables, the questions and impact that were most needed to advance food system resilience, and dimensions of racial equity within food systems that were most important to capture.
Although we initially tried cluster analysis because of its capacity to create county groups with shared risk profiles, we found few interpretable patterns in the resulting clusters. We believe cluster analysis would be better suited to research that focuses on just one of the many domains related to food system resilience that we consider here, whereas we had too many variables of interest to find clear, shared characteristics amid statistical noise. For instance, which counties produce food and which counties struggle to adequately access food may be very different in ways that cannot be easily summarized in a descriptive analysis. Further, not all counties experienced climate hazards in the past 10 years (or the types of hazards we focused on in this analysis) — but this doesn’t mean these counties aren’t vulnerable. The varied geographical landscapes of food production, food access and security, and current climate hazards makes it challenging to detect consistent and clear patterns among these interrelated factors — but all the more important to deeply understand.
To extract meaning from this novel dataset we assembled, we settled on a more descriptive, user-focused, and intuitive product based on input from community stakeholders. Put another way, instead of reformulating our research questions to match a specific methodology, we rescoped the analysis to address the research questions and use cases elevated by our conversations with stakeholders. The final product brings together data science and analytical tools; Urban’s subject matter expertise in food systems, climate, and racial equity; and direct feedback from partners grappling with these questions in the field.
To best understand the intersection of climate hazards, food systems, and racial equity moving forward, we must center community needs and collaborate with community members in developing research. Many community-led organizations are already leading the effort to ameliorate inequities in the food system, including capital access and insurance, supports for traditional foods, and equitable pay structures for agricultural workers of color. By collaborating directly with communities, we can generate insights that support vulnerable communities and drive their ability to develop and sustain resilient and equitable local food systems.
If this is an area of interest for you or your organization, if you have questions about the data or research, or if you are interested in collaborating on this work, please reach out to: foodandclimate@urban.org.