Iterated fact sheets with R Markdown
Getting the right information into the right hands is important. Whether it’s a mayor trying to tackle the opioid epidemic in California or a nationwide foundation trying to better understand how to serve varied communities, decisionmakers want information that will help them solve their problems.
Disseminating information often requires distilling reports about many communities into fact sheets with the relevant information for the individual communities where decisions are made. These fact sheets are often one or two pages, are visually interesting, and include data visualizations and key statistics. But creating fact sheets that are customized for specific locations or time periods and are visually interesting can be labor intensive if done by hand, and deadlines can be missed if last-minute changes need to be made to factsheet after factsheet.
Urban Institute researchers who want to break research into smaller pieces can use R Markdown. R Markdown simplifies this task because one template can be used to create many fact sheets over multiple geographies or periods of time with a few lines of code and the click of a button. When producing fact sheets about the opioid epidemic, Urban researchers created a template in R Markdown and used it to create county-level fact sheets with county-specific narrative, statistics, and plots.
R Markdown
R Markdown is a free, open-source framework for programmatically creating documents. R Markdown files are plain text files that end in “.Rmd” and typically include a combination of text and code. RMD files can output to several file types, including PDFs, Microsoft Word documents, websites, and books. These files can contain formatted text, code, and output like plots and tables.
R Markdown was created as a tool for computational reproducibility, but code that is reproducible is also scalable. This post will focus on using .Rmd documents to create multiple fact sheets. If you are new to R Markdown, RStudio has an exceptional website for new users who want to learn the basics.
Creating multiple fact sheets with R Markdown requires three ingredients:
1. Data structures that can be subset by the unit represented by the fact sheets (e.g., by state, county, or year)
2. A parameterized template
3. A script for looping through each unit from ingredient 1 and knitting the .Rmd documents
Subsettable data
One way to create subsettable data for R Markdown is with one data frame that has a variable or set of variables that can be filtered to represent each unit, such as a state variable. A second way is to have separate data files for each unit of fact sheet. Here, you could have a data folder with a .csv for each state and read a different .csv for each fact sheet.
For this example, I’ll use the bad_drivers dataset from library(fivethirtyeight). It has data for all 50 states and Washington, DC, and contains information on fatal collisions and insurance premiums for select years between 2009 and 2012. A complete set of code is available in this GitHub repository.
First, let’s subset the data for Virginia and build a bar plot. All the plots in this post are styled by the Urban Institute ggplot2 theme.
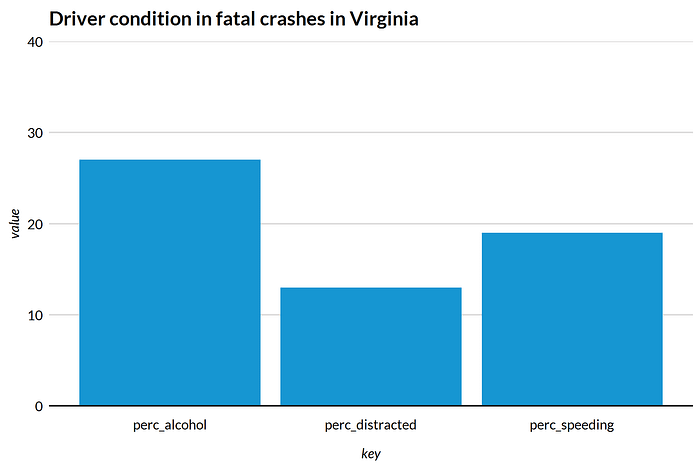
Now, I have a plot that’s perfect for a fact sheet about the dangers of driving in Virginia. I also have a data frame about Virginia that I can use to make other plots and tables or reference in text.
Parameterized template
The second ingredient is a parameterized template. Most .Rmd files are designed to create exactly one output document. Plots like the one above are created with hard-coded values in functions that subset the data, like state == “Virginia”.
To create a fact sheet for each state, you’ll need to parameterize the values that you want to change from fact sheet to fact sheet. In this case, that’s “Virginia” in filter(state == “Virginia”) and labs(title = “Driver condition in fatal crashes in Virginia”). This requires adding parameters to the YAML (Yet Another Markdown Language) header of the .Rmd file and referencing those parameters in the code.
R Markdown documents have YAML headers at the top of the script that contain information about the document like title, author, and output format. Parameters used throughout the document can be specified in the YAML header under params. Here, I specify a character vector of length one with the value “Virginia” at the beginning of the R Markdown document.
Parameters can then be accessed in all subsequent code via the params object. For example, “Virginia” in the code above would be replaced with params$state.
R evaluates this code in the same way as in the earlier example, except now, it is easy to change values. If “Virginia” shows up five places in your script and you want to switch to “Idaho,” it needs to be changed only in the YAML header, not five times throughout the document. In this process, str_c() and str_glue() from library(stringr) are key for manipulating text strings like the title in the plot above.
R Markdown can handle any number of parameters, which can be text strings like above or vectors like c(“District of Columbia”, “Maryland”, “Virginia”). To use vectors or evaluated expressions, add !r. The following YAML header would be good for making a fact sheet about the “DMV” area, which is made up of the District of Columbia, Maryland, and Virginia.
iterate.R
The final ingredient is code to iterate rendering R Markdown documents over a variable — in this case, multiple states. To create multiple fact sheets, we need the parameters and the output file name to change for each fact sheet. In this way, the plots, tables, and text update, and we end up with a uniquely named fact sheet for each unit. One way to do this is to change the parameters and file name by hand and then knit each fact sheet by clicking the “knit” button at the top of RStudio.

But this is labor intensive, error prone, and no fun — all the things we’re trying to avoid by scripting fact sheet creation in the first place.
A better way is to use render() from library(rmarkdown). I always create a separate script called iterate.R. So I now have two files — a .Rmd file named demonstration.Rmd and an R script called iterate.R. The iterate.R script has a data frame with parameters to pass to render() and the names of the fact sheets. The following code creates a data structure of parameters (state name) and output files named with the state name ending with “-driving.html”.
It then uses pwalk from library(purrr) to render each HTML document using rmarkdown::render() for demonstration.Rmd across the output file names and parameters in the data frame. The parameters are in nested lists, and parameters passed to .Rmd will overwrite any parameters of the same name in the YAML header. For example, if the .Rmd includes “Virginia” as a parameter in the YAML header but “Virginia” isn’t included in params in the above data frame, no fact sheet for Virginia will be created. Only fact sheets for the states in the report’s dataset above will be generated.
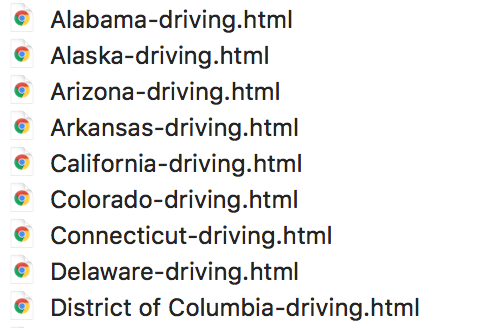
And just like that, we produce unique fact sheets for all 50 states and the District of Columbia. Here, we see the first nine fact sheets from the output directory.
These fact sheets can be further styled with additional R code and CSS styles.
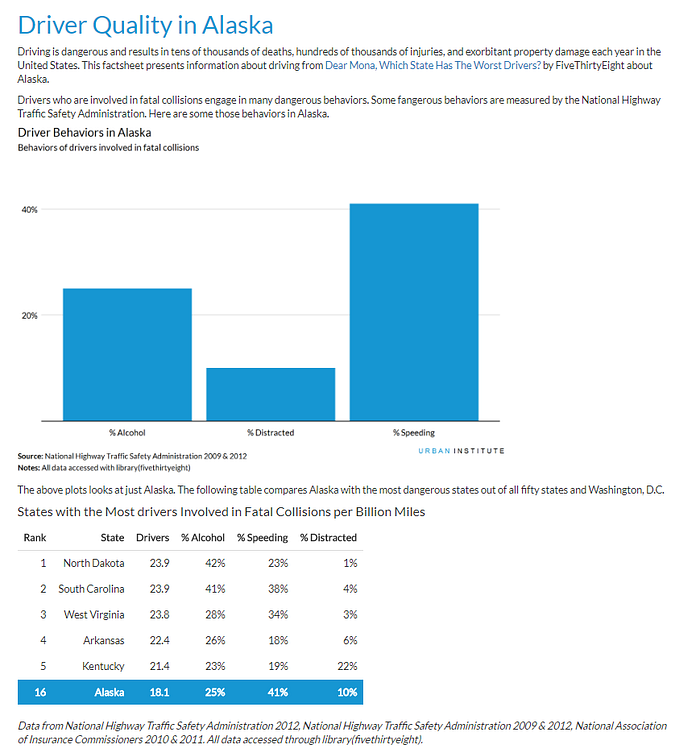
A set of the above fact sheet with extra styling is available here. We are working on styles so they closely match the existing Urban Institute publication formats. In time, we will be able to match outputs to the current publications style.
Disadvantages
Before setting out to make fact sheets, it’s important to consider some of the advantages and disadvantages of R Markdown. Iterating fact sheets with R Markdown requires additional up-front work. The cost of that up-front work can be justified only if time is saved while making every fact sheet beyond the first. Many programmers follow the rule of three: Anytime something is copied three times, it should be abstracted into a new procedure or function. But even with three iterations, working by hand could be justified. In particular, extra code might be required to handle labels that vary in length from fact sheet to fact sheet and outliers, so consider whether R Markdown is needed on a case-by-case basis.
R Markdown was designed to simplify the writing process. It intentionally can’t do everything. Some things that can be accomplished by hand can’t be done programmatically. This can be frustrating at first. But there’s a lot that can be done with tools like ggplot2 that can’t be done by hand. Furthermore, .Rmd files are generalized so one template can create multiple types of output — HTML, PDF, or even a book — which allows for flexibility and efficiency in dissemination. These trade-offs should be considered before starting a project.
Advantages
The marginal effort to make a second (or third, or fiftieth) fact sheet is small after you create the right data structures, a template, and iterate.R.
With R Markdown, you can stun your collaborators with speed. Iterating a change requires editing the code and submitting iterate.R. The code for most fact sheets runs quickly, so if a collaborator wants an edit, you can return the updated fact sheets in minutes. This speed is exceptional when battling deadlines and has impressed more than one Urban Institute researcher requesting last-minute changes to an array of fact sheets.
Finally, it can be tough to make all margins and placement identical across fact sheets when working by hand. With R Markdown, all fact sheets should have a uniform appearance because they come from one template.
Programmatically iterating R Markdown isn’t the solution to every problem, but it is an exceptional solution to a specific problem. When Urban Institute researchers want to break research into smaller pieces, it is a powerful tool for creating iterated fact sheets.
For more information about R Markdown, read Bookdown, read Blogdown, or visit the RStudio intro to R Markdown website.