How We Designed a User-Friendly Web Data Connector
*An earlier version of this post incorrectly referred to Reboot Representation as Pivotal Ventures. Pivotal Ventures is one of Reboot Representation’s major funders (corrected 6/3/22).
The Urban Institute’s Education Data Portal contains a vast amount of information and pulls data from varied sources, features that offer immense potential to our users but can also be extremely overwhelming. To provide a new, fast, and user-friendly option for users to access the Education Data Portal, we wanted to build a Tableau web data connector (WDC).
WDCs are web pages that allow users to connect to data sources through their internet browsers. Users can create their own WDC or use one created by others. To create our WDC, we first needed to find a user base and narrow in on the data those users needed to pull from the portal.
Understanding our user base and their needs
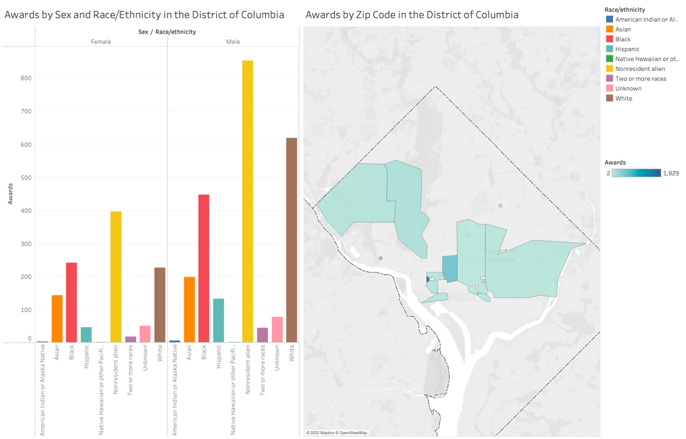
We found that a subset of users were using the education data to increase diversity within the computing field, and as a result, we worked closely with Reboot Representation, an organization dedicated to increasing the number of Black, Latina and Native women in computing, to design the WDC. Reboot Representation, and several similar organizations, work with computer science graduation data, disaggregated by race and gender, from the Integrated Postsecondary Education Data System (IPEDS). These data can be used to answer the following questions:
· Which universities have the most Black, Latina, or Native women graduating with computing degrees?
· Which of those are historically Black colleges and universities or tribal colleges?
· How have those results changed over time?
· Which universities are closest to gender parity?
· How do the graduation rates differ between public and private universities?
Building and testing our tool
Of the Education Data Portal’s various endpoints, the IPEDS 2-Digit Awards endpoint contained the graduation data we were looking for and was already disaggregated by race and gender. For our tool to be most effective, we also needed to pull institutional indicators that could contextualize the awards data.
We built our connector using the JavaScript WDC Software Development Kit. A connector must accomplish two main functions: creating the schema and fetching the data. To fetch the data, we fetched the corresponding endpoints of the Education Data Portal’s API, parsed the response data to match the schema, and passed the data into the schema. Our connector schema was designed to pull in two tables: the graduation data, disaggregated by race and gender, and a second table of institutional indicators that could be joined into the graduation data and provide institutional context to our user’s analysis.
Our connector was querying two endpoints — one for awards and one for institutions — each containing multiple pages of data. After our initial testing, it was clear we needed to limit the size of the data tables because users were waiting too long for their data to load (often more than five minutes). The Education Data Portal stores data on various endpoint URLS, each of which contains numerous pages to be fetched, and the time it takes to fetch these pages increases exponentially with each added page.
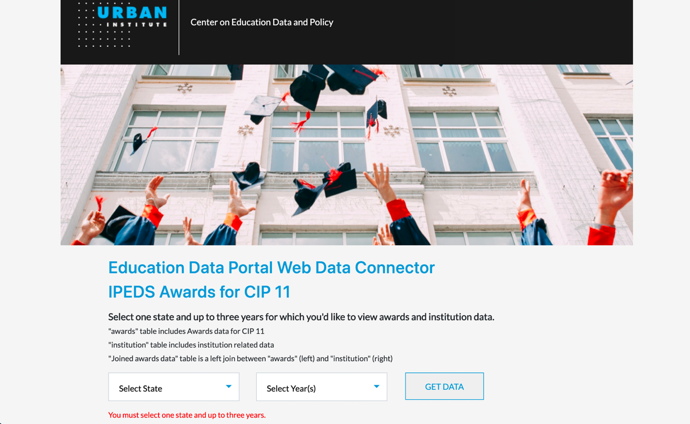
To limit the number of pages queried from each endpoint, we decided to bound our data by geography and/or date. But before we could, we needed to understand how these limitations would affect the use cases. Our users said comparing data over time was very important to them, so we limited our data to a single state and up to three years at a time. The data contained other geographic indicators, such as zip codes, core based statistical areas, and congressional districts, so that graduation rates could be still be compared geographically within a state.
Disseminating our tool
Now that our WDC is complete, we want to share it with other users who may be interested in pulling the data. The GitHub repository for our publicly available WDC can be found here. This repository includes instructions on how to use the tool, as well as a more detailed description of the data. In the coming year, we intend to speed up the Education Data Portal API and build additional versions of this connector that allow users to pull in larger amounts of data not limited by state or year.
Ultimately, the immense amount of data in our Education Data Portal is only useful if our users find it easy and accessible to use. With this new WDC and the promise of similar projects, we believe we can harness the Education Data Portal’s full potential.